> ## Documentation Index
> Fetch the complete documentation index at: https://docs.veydra.io/llms.txt
> Use this file to discover all available pages before exploring further.
# Behavior Analysis
> Time series pattern detection and classification
## Overview
The [Behavior Analysis tool](https://app.veydra.io/behavior-analysis) automatically classifies time series data into recognizable patterns using statistical model comparison. Whether you're analyzing simulation outputs, historical data, or exploring synthetic patterns, this tool provides instant insights into the underlying behavior of your data.
## Core Technology
### Partnership with BEAMS
This behavior analysis capability was developed in partnership with the **BEAMS** (Benchmarking and Evaluating AI for Modeling and Simulation) project, which includes members of the system dynamics community and technical committee. The BEAMS project focuses on advancing AI applications in system dynamics and model-based analysis.
For more details about the BEAMS project, visit: [https://www.buffalo.edu/ai-data-science/research/beams.html](https://www.buffalo.edu/ai-data-science/research/beams.html)
This tool is part of the open source **SD-AI** project. The complete codebase and documentation can be found at: [https://ub-iad.github.io/sd-ai/](https://ub-iad.github.io/sd-ai/)
### Statistical Pattern Detection
The analyzer uses model selection to compare multiple behavioral models and identify the best fit:
* **Model Competition**: Multiple pattern models compete to explain your data
* **Automatic Selection**: Best-fit model chosen based on statistical likelihood
* **Confidence Scoring**: Probability weights show detection confidence
* **Robust Normalization**: Z-score normalization for scale-independent analysis
## Detected Behavior Patterns
The analyzer can identify **12+ distinct behavioral patterns** commonly found in system dynamics and time series data:
### Growth & Decline Patterns
| Pattern | Description | Common Examples |
| ----------------------- | --------------------------------------------------- | -------------------------------------- |
| **Exponential Growth** | Accelerating increase over time | Population growth, compound interest |
| **Exponential Decline** | Accelerating decrease over time | Radioactive decay, depreciation |
| **Linear Growth** | Steady, constant rate increase | Linear production, constant savings |
| **Linear Decline** | Steady, constant rate decrease | Linear depreciation |
| **S-Curve (Sigmoid)** | Growth that starts slow, accelerates, then plateaus | Technology adoption, market saturation |
### Cyclical Patterns
| Pattern | Description | Common Examples |
| -------------------------------- | --------------------------------------- | ---------------------------------- |
| **Oscillating** | Regular periodic fluctuations | Seasonal demand, business cycles |
| **Dampening** | Oscillations that decrease in amplitude | Spring motion, stabilizing systems |
| **Oscillating Trending Up/Down** | Cycles with underlying trend | Seasonal sales with growth |
### Transition Patterns
| Pattern | Description | Common Examples |
| ------------------------ | --------------------------- | -------------------------------------- |
| **Step Up/Down** | Sudden level change | Policy changes, price adjustments |
| **Peak (Bump)** | Rise then fall back | Campaign effects, temporary shocks |
| **Dip** | Fall then rise back | Crisis and recovery patterns |
| **Overshoot & Collapse** | Exceeds target then settles | Climate overshoot, population dynamics |
### Stability Patterns
| Pattern | Description | Common Examples |
| ------------ | ----------------------------------- | ------------------ |
| **Stable** | Constant value with minor variation | Equilibrium states |
| **Inactive** | Near-zero or no activity | Dormant systems |
## Using the Tool
### Synthetic Data Mode
Generate and analyze preset behavior patterns:
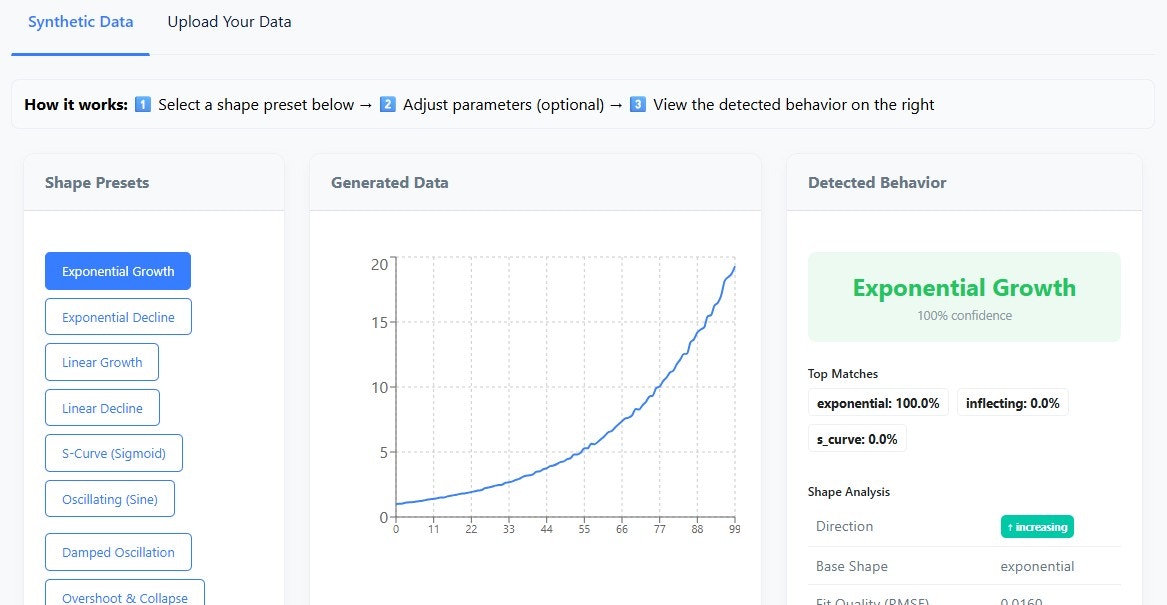 1. **Select a Pattern**: Choose from the pattern library dropdown
2. **Adjust Parameters**:
* Number of points (10-500)
* Noise level (0-50%)
* Amplitude, frequency, growth rate
3. **View Results**: See instant classification with confidence scores
Try adding noise to see how robust the detection is! Most patterns remain detectable up to 20-30% noise.
### Upload Your Data
Analyze your own CSV files:
1. **Select a Pattern**: Choose from the pattern library dropdown
2. **Adjust Parameters**:
* Number of points (10-500)
* Noise level (0-50%)
* Amplitude, frequency, growth rate
3. **View Results**: See instant classification with confidence scores
Try adding noise to see how robust the detection is! Most patterns remain detectable up to 20-30% noise.
### Upload Your Data
Analyze your own CSV files:
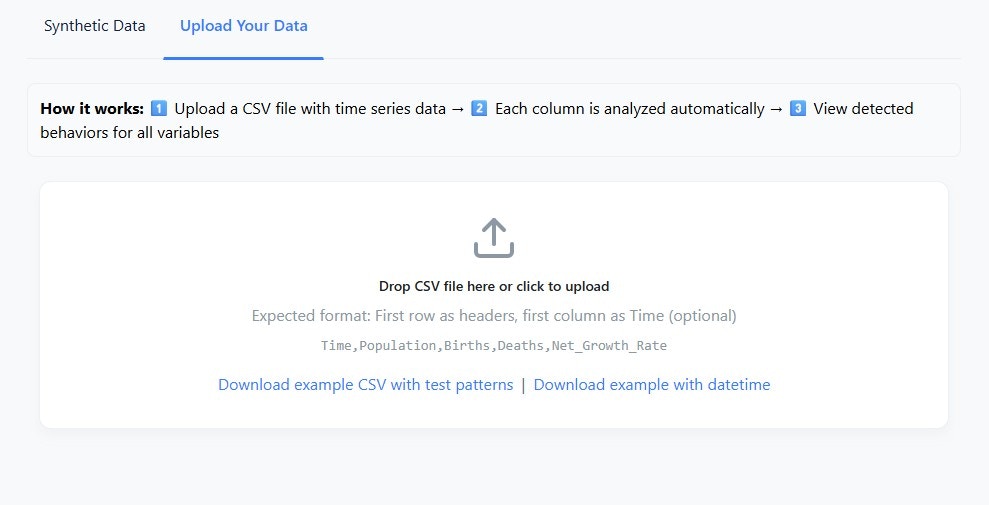 1. **Drag and Drop**: Drop a CSV file onto the upload area
2. **Format Requirements**:
* First row must contain column headers
* Each column is analyzed as a separate variable
* Optional: Include a "Time" or datetime column
3. **Multi-Variable Analysis**: All numeric columns analyzed simultaneously
#### CSV Format Examples
**Simple numeric data:**
```csv theme={null}
Time,Temperature,Pressure,Volume
0,20.5,101.3,1.0
1,21.2,101.5,1.02
2,22.8,102.1,1.05
...
```
**With datetime index:**
```csv theme={null}
DateTime,CO2_Emissions,Temperature,Sea_Level
2020-01-15,410.5,14.2,3.3
2020-02-15,411.2,14.1,3.4
2020-03-15,412.8,14.5,3.4
...
```
## Understanding Results
### Confidence Interpretation
| Confidence | Interpretation |
| ------------- | --------------------------------------- |
| **Above 70%** | High confidence - clear pattern match |
| **50-70%** | Moderate confidence - likely correct |
| **30-50%** | Low confidence - pattern unclear |
| **Below 30%** | Very uncertain - may be complex pattern |
### Scale Statistics
The analyzer provides comprehensive scale metrics:
* **Mean, Std, Min, Max**: Basic distribution statistics
* **Range**: Total variation in the data
* **Start/End Values**: First and last observed values
* **Delta & Delta %**: Absolute and percentage change
* **Direction**: Overall trend (increasing/decreasing/stable)
* **R²**: Linear fit quality (how well a line fits)
* **Correlation with Time**: Trend strength
### Handling Edge Cases
If the shape RMSE is high (above 0.85), the analyzer flags the result as "Possibly Complex or Unmodeled". This indicates the data may have:
* Multiple overlapping patterns
* Non-standard behavior
* High noise levels
* Structural breaks
Data close to zero is automatically detected and classified as "Inactive" when appropriate, using absolute thresholds rather than relative measures.
Constant or near-constant data is detected using coefficient of variation (CV below 0.1) and classified as "Stable".
## Use Cases
### Model Validation
Compare your simulation outputs against expected behaviors:
* Verify exponential growth models produce exponential patterns
* Confirm oscillating systems show proper dampening
* Detect unexpected step changes or transitions
### Data Exploration
Quickly characterize unfamiliar datasets:
* Identify dominant patterns in historical data
* Screen multiple variables for interesting behaviors
* Find cyclical patterns in operational data
### Teaching & Learning
Understand system dynamics archetypes:
* Generate synthetic examples of each pattern
* See how parameters affect behavior
* Learn pattern recognition visually
## Technical Details
### Performance
* **Analysis Time**: Typically under 1 second per variable
* **Memory**: Runs entirely in browser memory
* **Data Limits**: Optimized for series up to 10,000 points
### Supported Formats
* CSV files with numeric columns
* Optional datetime column (auto-detected)
* Missing values handled via linear interpolation
The behavior analysis tool uses the same Pyodide runtime as the simulation engine, so if you've run a simulation, the Python environment is already loaded.
1. **Drag and Drop**: Drop a CSV file onto the upload area
2. **Format Requirements**:
* First row must contain column headers
* Each column is analyzed as a separate variable
* Optional: Include a "Time" or datetime column
3. **Multi-Variable Analysis**: All numeric columns analyzed simultaneously
#### CSV Format Examples
**Simple numeric data:**
```csv theme={null}
Time,Temperature,Pressure,Volume
0,20.5,101.3,1.0
1,21.2,101.5,1.02
2,22.8,102.1,1.05
...
```
**With datetime index:**
```csv theme={null}
DateTime,CO2_Emissions,Temperature,Sea_Level
2020-01-15,410.5,14.2,3.3
2020-02-15,411.2,14.1,3.4
2020-03-15,412.8,14.5,3.4
...
```
## Understanding Results
### Confidence Interpretation
| Confidence | Interpretation |
| ------------- | --------------------------------------- |
| **Above 70%** | High confidence - clear pattern match |
| **50-70%** | Moderate confidence - likely correct |
| **30-50%** | Low confidence - pattern unclear |
| **Below 30%** | Very uncertain - may be complex pattern |
### Scale Statistics
The analyzer provides comprehensive scale metrics:
* **Mean, Std, Min, Max**: Basic distribution statistics
* **Range**: Total variation in the data
* **Start/End Values**: First and last observed values
* **Delta & Delta %**: Absolute and percentage change
* **Direction**: Overall trend (increasing/decreasing/stable)
* **R²**: Linear fit quality (how well a line fits)
* **Correlation with Time**: Trend strength
### Handling Edge Cases
If the shape RMSE is high (above 0.85), the analyzer flags the result as "Possibly Complex or Unmodeled". This indicates the data may have:
* Multiple overlapping patterns
* Non-standard behavior
* High noise levels
* Structural breaks
Data close to zero is automatically detected and classified as "Inactive" when appropriate, using absolute thresholds rather than relative measures.
Constant or near-constant data is detected using coefficient of variation (CV below 0.1) and classified as "Stable".
## Use Cases
### Model Validation
Compare your simulation outputs against expected behaviors:
* Verify exponential growth models produce exponential patterns
* Confirm oscillating systems show proper dampening
* Detect unexpected step changes or transitions
### Data Exploration
Quickly characterize unfamiliar datasets:
* Identify dominant patterns in historical data
* Screen multiple variables for interesting behaviors
* Find cyclical patterns in operational data
### Teaching & Learning
Understand system dynamics archetypes:
* Generate synthetic examples of each pattern
* See how parameters affect behavior
* Learn pattern recognition visually
## Technical Details
### Performance
* **Analysis Time**: Typically under 1 second per variable
* **Memory**: Runs entirely in browser memory
* **Data Limits**: Optimized for series up to 10,000 points
### Supported Formats
* CSV files with numeric columns
* Optional datetime column (auto-detected)
* Missing values handled via linear interpolation
The behavior analysis tool uses the same Pyodide runtime as the simulation engine, so if you've run a simulation, the Python environment is already loaded.